In this video we go over a modern monitoring stack: Telegraf, InfluxDB and Grafana. The video is based on Ubuntu 20.04 on a Raspberry Pi but it will work for any modern Linux distribution.
This solution stack is made up of three components.
- Telegraf -- A server agent for collecting metrics (CPU, RAM etc.)
- InfluxDB -- A Time Series Database to store the data.
- Grafana -- A multiplatform data analytics dashboard.
Telegraf will grab the metrics and send them to InfluxDB to be stored. Grafana will then query InfluxDB and display the metrics on a Dahboard.
InfluxDB
What is InfluxDB?
A time series database (TSDB) is a database optimized for time-stamped or time series data. It's built specifically for handling metrics, events and measurements that are time-stamped and is very good at measuring changes over time.
Installing InfluxDB
Add the Influx Repos:
wget -qO- https://repos.influxdata.com/influxdb.key | sudo apt-key add -
source /etc/lsb-release
echo "deb https://repos.influxdata.com/${DISTRIB_ID,,} ${DISTRIB_CODENAME} stable" | sudo tee /etc/apt/sources.list.d/influxdb.list
Next, update apt cache, install influxdb and start the Influxdb Daemon
sudo apt-get update && sudo apt-get install influxdb
sudo service influxdb start
Once Influx is running, access the database by running the influx binary.
influx
You will be prompted with a shell. Below are the commands to create the database and create a user. Use the username/password you want.
create database rpi_monitoring;
CREATE USER rpi WITH PASSWORD 'rpi' WITH ALL PRIVILEGES;
If you want to see what you created, here are the show commands:
show databases;
show users;
Installing Grafana
How to install Grafana
Grab Grafana and extract
cd /opt
wget https://s3-us-west-2.amazonaws.com/grafana-releases/release/grafana-3.1.1-1470047149.linux-x64.tar.gz
tar -zxvf grafana-3.1.1-1470047149.linux-x64.tar.gz
Then launch the Grafana binary.
cd /opt/grafana-3.1.1-1470047149/bin
./grafana-server
Accessing Grafana Server:
Grafana listens on port 3000, access it per below, replacing the IP with your servers IP address.
http://<IP-SERVER>:3000
Grafana Default Login Credentails
The default login credentials for Grafana is admin/admin
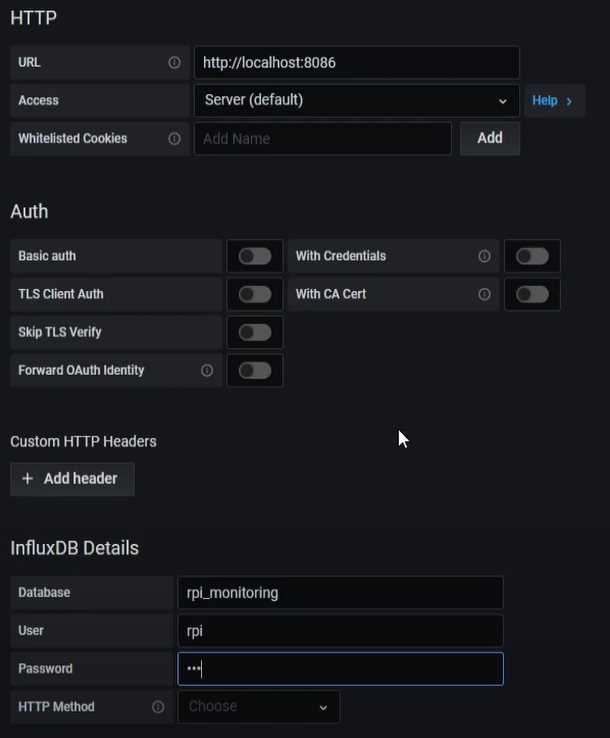
Configure a Data Source
Click the Cogwheel -> Data Source -> Add Data Source
Fill out the information, pointing to your InfluxDB. My configuration looks like this:
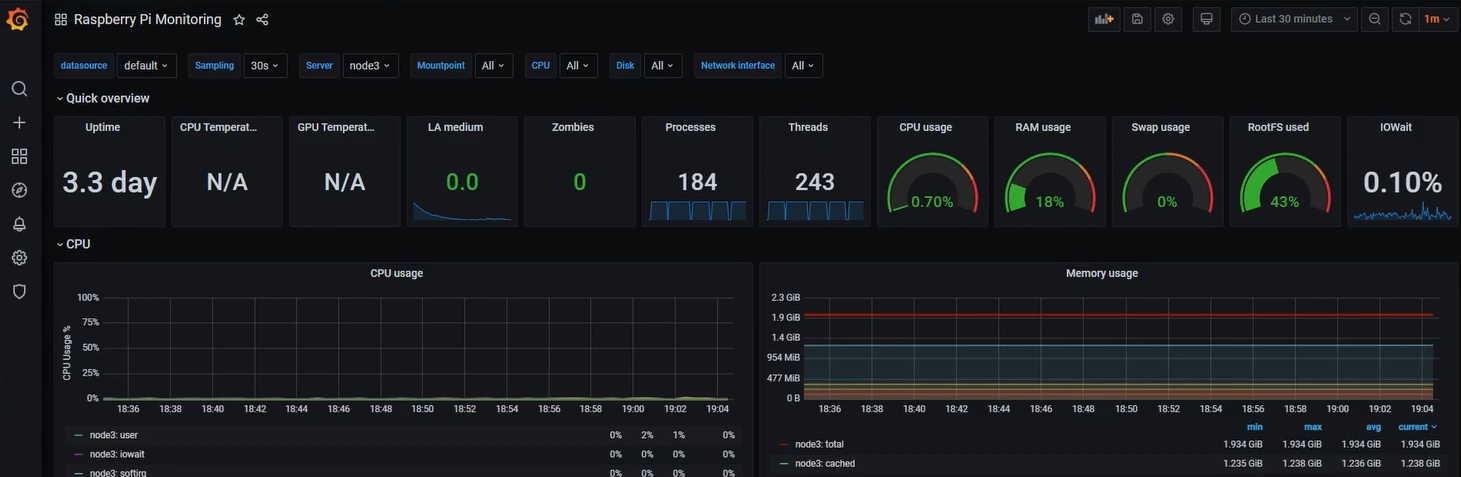
Import the Dashboard into Grafana
To import the Raspberry PI Dashboard into Grafana:
Click the + symbol -> Import -> Import via grafana.com
This uses the Dashboard from Grafana.com: https://grafana.com/grafana/dashboards/10578
Installing Telegraf
Installing Telegraf - Ubuntu 20.04
I am using ubuntu 20.04, but it should be a similar process for other releases.
The first step is to add the sources
wget -qO- https://repos.influxdata.com/influxdb.key | sudo apt-key add -
source /etc/lsb-release
echo "deb https://repos.influxdata.com/${DISTRIB_ID,,} ${DISTRIB_CODENAME} stable" | sudo tee /etc/apt/sources.list.d/influxdb.list
After that we run an apt-update and install telegraf.
apt update
apt install telegraf
Enabling Telegraf
Once installation is complete, we will have to enable the service.
systemctl enable --now telegraf
Telegraf Configuration
Use your favorite editor to edit the telegraf configuration file.
nano /etc/telegraf/telegraf.conf
Once in there, replace the InfluxDB section with the below. Make sure to change the username/password if you are using something different.
[[outputs.influxdb]]
  urls = ["http://127.0.0.1:8086"]
  database = "rpi_monitoring"
  username = "rpi"
  password = "rpi"
Restarting Telegraf
Restart Telegraf
systemctl restart telegraf